Analysis of Wednesday's Trades:
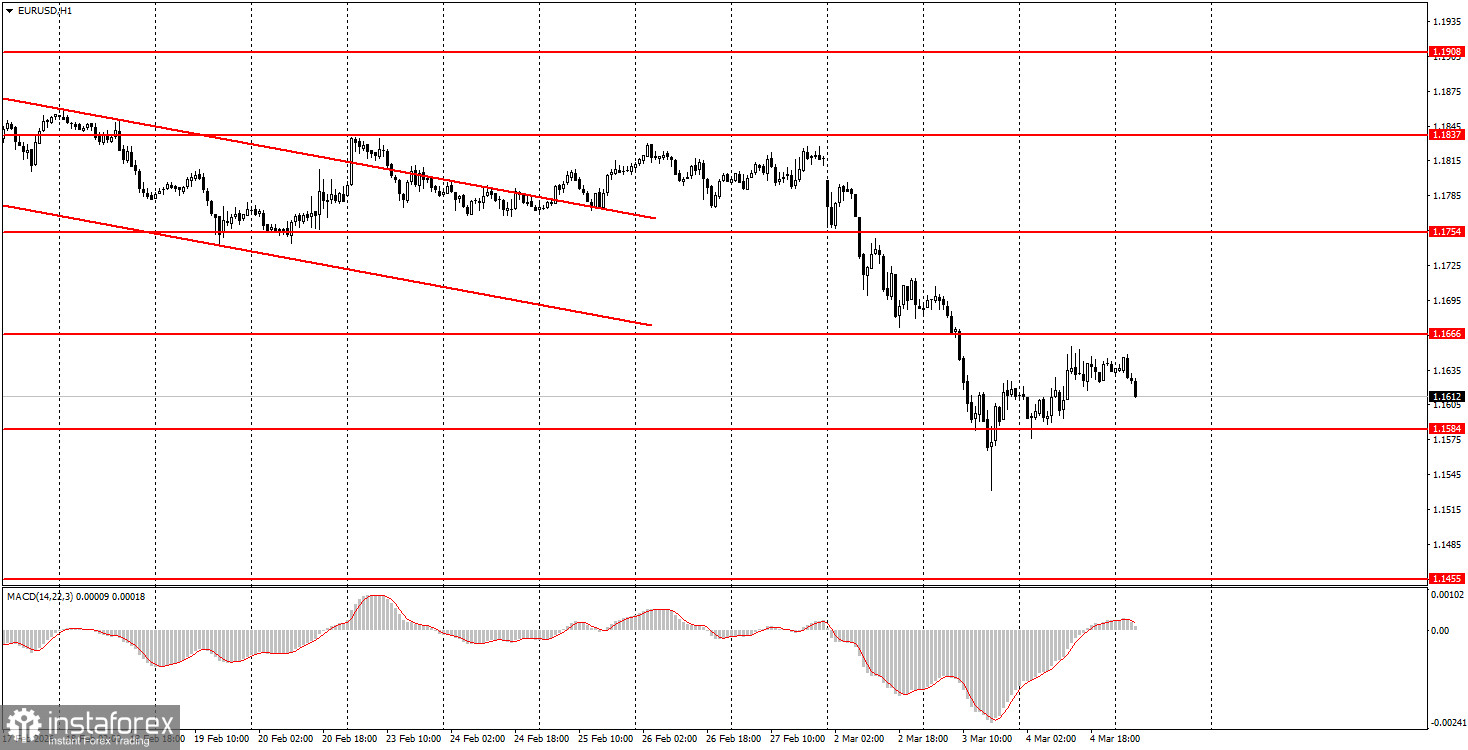
1H Chart of the EUR/USD Pair
The EUR/USD currency pair firmly aimed for a slight correction on Wednesday after a two-day decline, which we did see. In the morning, the Eurozone's unemployment rate unexpectedly fell to 6.1%, providing additional support for the European currency. However, the US ADP and ISM reports suggested a strengthening of the US dollar, contradicting market expectations of a correction, leading to no market reaction despite their positive outlook. Overall, the market continues to depend on geopolitics. More countries are becoming involved in the war in the Middle East, and yesterday, NATO Secretary General Mark Rutte announced the possible activation of the collective defense article against Iran. What this means is still unclear, and NATO continues to work hard to avoid getting involved in any conflicts. Nonetheless, this is the first such statement from NATO representatives in recent years. Additionally, Donald Trump stated that the US continues to work on establishing control over Greenland. What this may signify is also not understood at this time. One thing is clear: there is still a long way to go before the storm subsides in all markets.
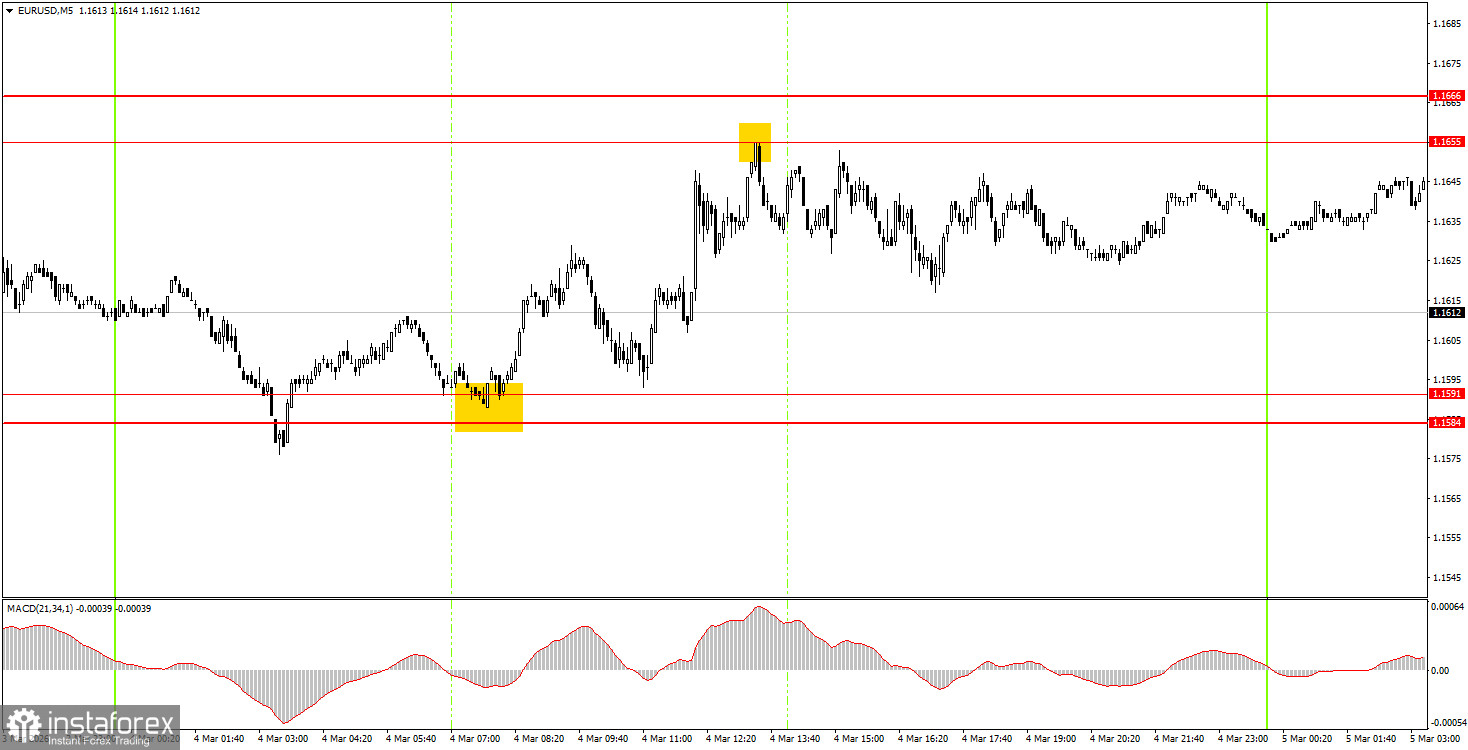
5M Chart of the EUR/USD Pair
On the 5-minute timeframe, two excellent trading signals were formed on Wednesday. During the European trading session, the price bounced off the area of 1.1584-1.1591 and reached the area of 1.1655-1.1666 before the American session began, from which it also bounced. Thus, beginner traders could initially open long positions and later short positions. Both trades brought profits to traders.
How to Trade on Thursday:
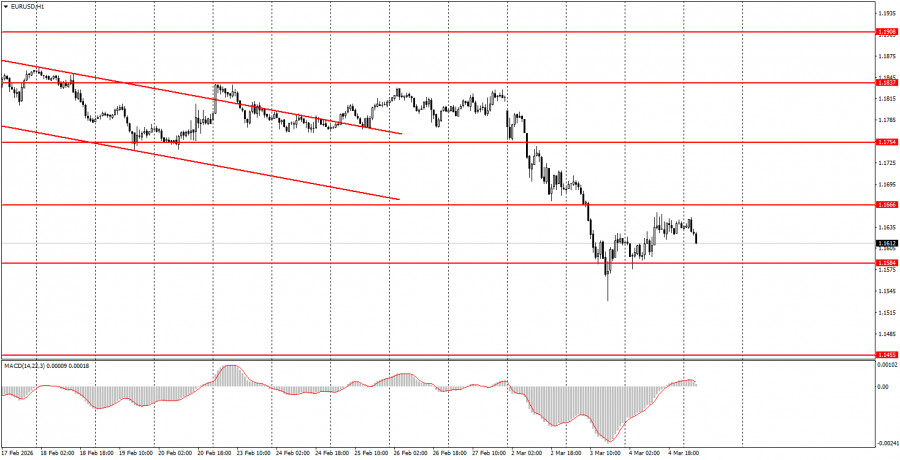
On the hourly timeframe, the downward trend has resumed, but only "thanks" to the new war in the Middle East. At the beginning of 2026, a long-term upward trend resumed, so we expect renewed medium-term growth for the euro. The overall fundamental backdrop remains very challenging for the US currency; however, the market's main focus currently is geopolitics rather than the economy.
On Thursday, beginner traders may consider short positions if the price consolidates below the 1.1584-1.1591 range, targeting 1.1527-1.1531. A bounce off the area of 1.1584-1.1591 will allow for opening long positions with a target of 1.1655-1.1666.
On the 5-minute timeframe, levels to consider are 1.1455-1.1474, 1.1527-1.1531, 1.1584-1.1591, 1.1655-1.1666, 1.1745-1.1754, 1.1830-1.1837, 1.1899-1.1908, 1.1970-1.1988, 1.2044-1.2056, and 1.2092-1.2104. On Thursday, significant events in the Eurozone include a speech by Christine Lagarde and a retail sales report. In the US, only unemployment claims will be released. Geopolitics will continue to drive the markets.
Key Principles of the Trading System:
- The strength of a signal is determined by the time it takes to form the signal (bounce or breakout). The less time taken, the stronger the signal.
- If two or more trades have been opened at a particular level based on false signals, all subsequent signals from that level should be ignored.
- In a flat market, any pair can form many false signals or none at all. In any case, at the first signs of a flat trend, it is best to stop trading.
- Trading deals are to be opened during the period between the start of the European session and the mid-American session, after which all trades should be closed manually.
- On the hourly timeframe, it is preferable to trade based on signals from the MACD indicator only when there is good volatility and a trend confirmed by a trend line or trend channel.
- If two levels are positioned too close together (5-20 pips apart), they should be considered a support or resistance area.
- Upon moving 15 pips in the correct direction, a Stop Loss should be set to breakeven.
What to Look for on the Charts:
Price levels of support and resistance are levels that serve as targets when opening buys or sells. Take Profit levels can be placed around them.
Red lines represent channels or trend lines that show the current trend and indicate the direction in which it is preferable to trade now.
The MACD indicator (14,22,3) – the histogram and the signal line – is a supporting indicator that can also be used as a source of signals.
Important speeches and reports (always included in the news calendar) can significantly affect the movement of the currency pair. Therefore, during their release, trading should be done with utmost caution, or traders should exit the market to avoid sharp price reversals against the previous movement.
Beginning traders in the forex market should remember that not every trade can be profitable. Developing a clear strategy and effective money management are the keys to long-term trading success.